All discussions about IoT data include the highly-important type known as “Time-Series,” which is, as the name implies, successive readings paired with their corresponding points in time. Potentially generating a tremendous number of data points, time-series data can be a challenge to manage and scale.
For remote monitoring, virtually every IoT use case involves a time series of some kind. When sensing temperature, humidity, pressure, or just about any other physical phenomenon, there is a need to capture values over time. The data’s business purpose drives the required frequency (every second, minute, hour, etc.).
Often the assumption is that the application should store every reading from every device in a database. A data value may be useful, however, only briefly. When monitoring a motor’s temperature every second, it may not be necessary to store every single value, but instead, capture only those representing a deviation from the norm. Understanding the business purpose of the data drives the storage requirements, which should keep only that which has future importance. Particularly for large implementations with many thousands of sensors, this can lower storage costs.
What can we observe about a time series of IoT data? Is the trend typical? Are there any irregularities? Do inconsistencies happen at a particular time of day or when the same crew is working (the night shift, for example)? From a broader perspective, do they possibly occur in the summer when temperatures are higher? As data is further understood, a pattern or “seasonality” may reveal itself.
Drawing conclusions and taking actions may require sophisticated statistical and data analysis in environments where the raw time series data need more in-depth interpretation. With proper modeling, machine learning may be the key to digesting vast data points to drive decisions.
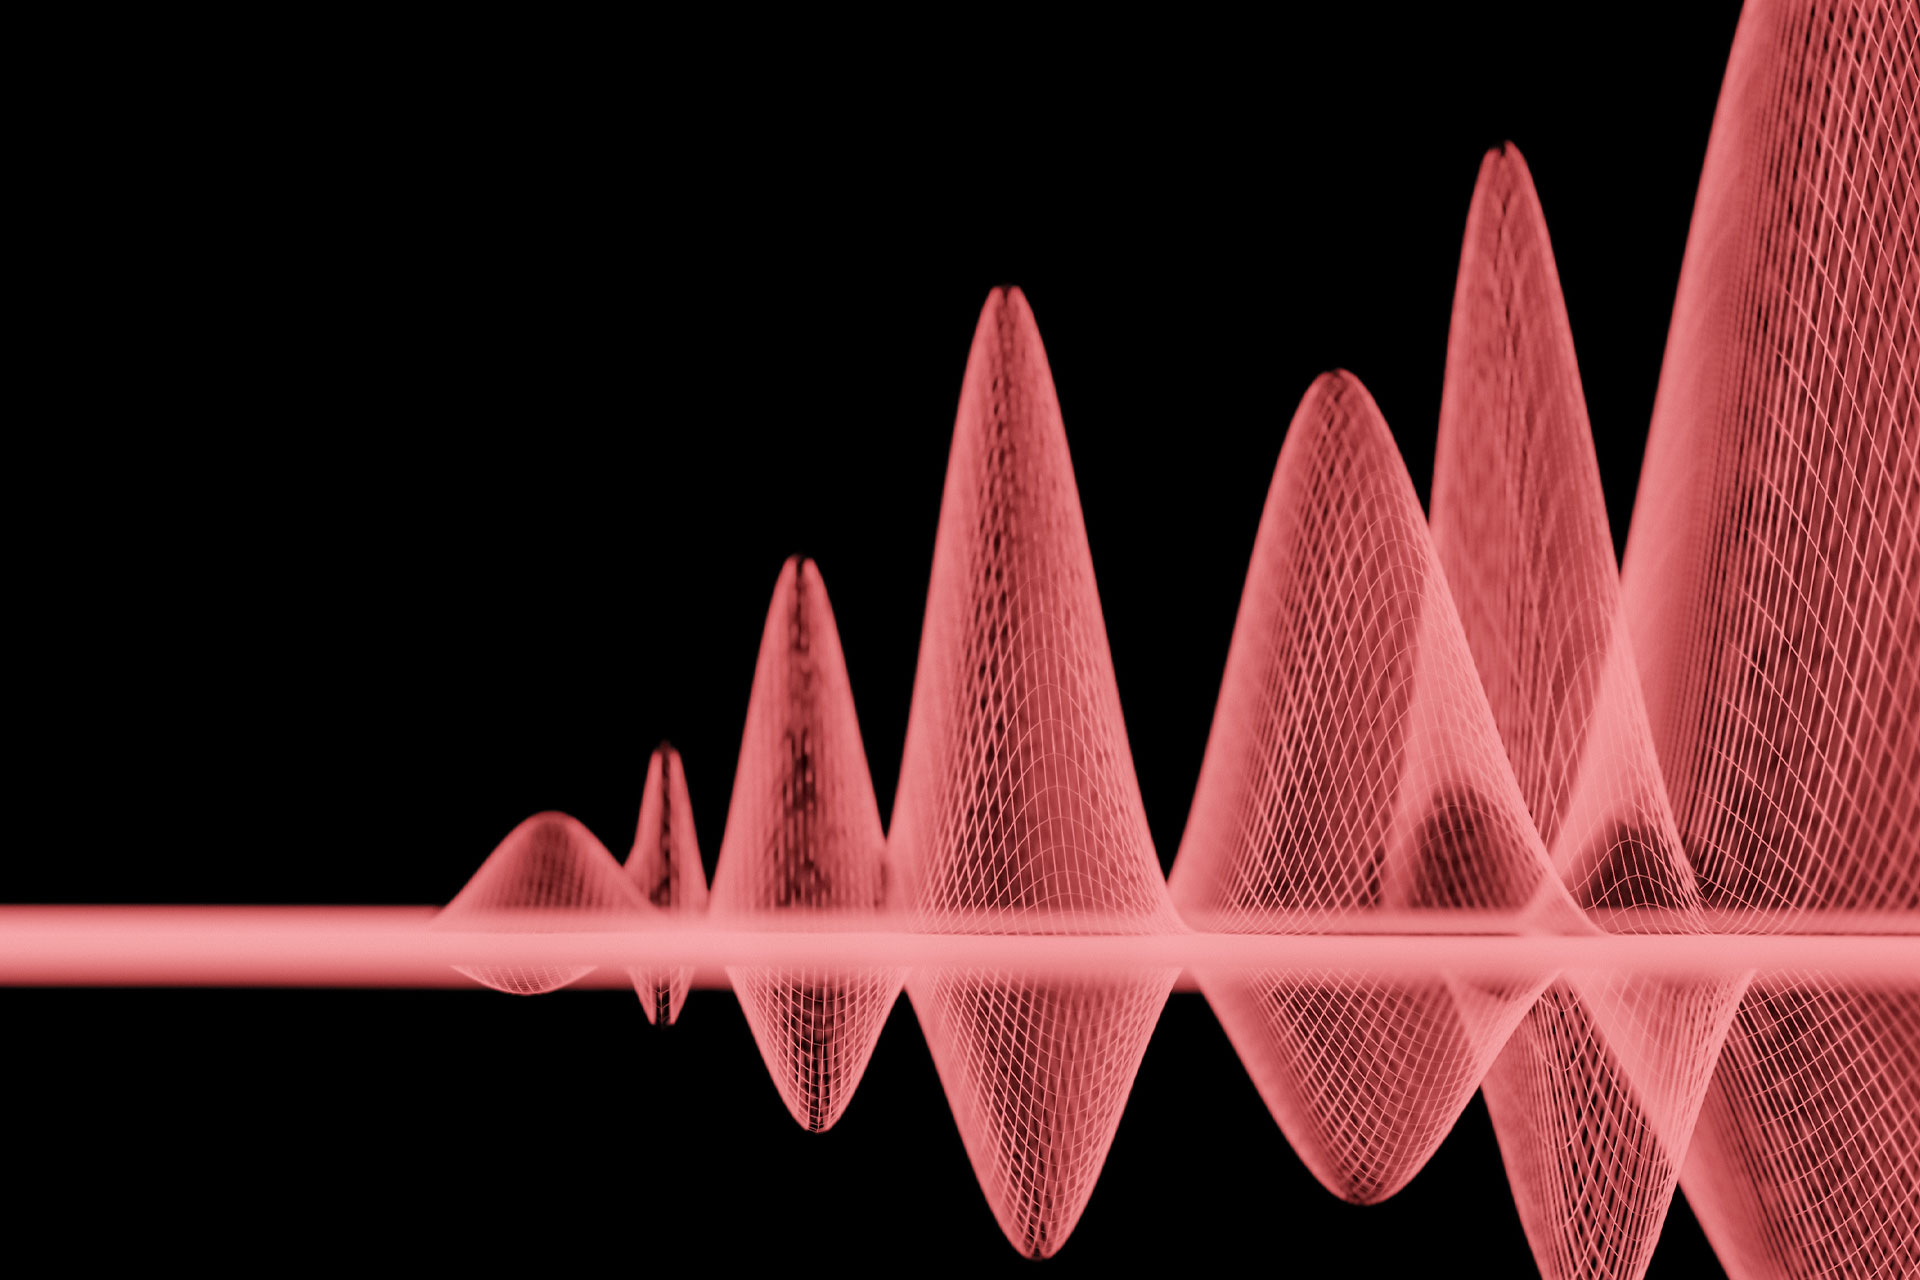
In some applications, transforming the raw data from sensors in real-time is a requirement for it to be useful. When monitoring vibration, for example, the conversion of sound waves into the different frequency components is often required to turn the data into actionable information.
For a time series, the most common visualization is a graph showing trends, cycles, and irregularities. Often, an IoT user application will focus primarily on aberrations in the time series. When one occurs, it may generate an alert. Robust user interfaces provide informative and timely alerts with the ability to drill down into the underlying data to investigate quickly.
There are database products explicitly designed for Time-Series data purporting to be the best for creating, updating, and managing it. Their focus includes:
- Supporting fast, efficient read/write operations
- Efficient storage of data (using compression methods, for example)
- Aggregation functions (i.e., sums, counts, averages, etc. of sample data over a specific period)
- Automated “roll-ups,” “pruning,” or truncation of data
Many projects effectively use other SQL and non-SQL database management systems, so a category-specific database is not a requirement for success. With any DBMS, it’s critical to ingest and analyze the data rapidly with the ability to scale for a large volume. Efficiently deploying a version of the database to an edge device may also be an important consideration.